 Search
Fetal Doppler Information and Imaging Considerations
Page Links: Fetal Doppler, Doppler Effect, Flow Velocity Waveform, Types of Instrumentation, Color Doppler Imaging, Umbilical Artery Doppler and Placental Relationships, Doppler Waveform Analysis, Basic Fetal Doppler Principles, Indications for Fetal Doppler, Assessment of Fetal Circulation: Umbilical Artery, The Umbilical Artery Waveform’s Relationship to Placental Anatomy, When is the Artery Doppler Value Abnormal?, Clinical Significance of the Umbilical Artery Waveform, Causes of Fetal Growth Restriction, Management of Fetal Growth Restriction Due to Placental Insufficiency with Umbilical Artery Doppler, Fetal Doppler and Late Onset PIH, Small for SGA Prediction, Uterine Artery, Uterine Artery Clinical Application, Middle Cerebral Artery (MCA), Ductus Venosus, Sequential Changes in the Fetus Due to Placental Insufficiency, References

An overview of the essentials of fetal Doppler is provided, including basic Doppler concepts, spectral waveform analysis, and assessment of the fetal circulation, including the umbilical, uterine, middle cerebral artery, and the ductus venosus. A focus is placed upon studies of the umbilical artery since the incorporation of umbilical artery waveform data in the management of intrauterine growth retardation (IUGR) has resulted in a significant decrease in labor induction, cesarean delivery, and perinatal deaths. [1]
In a recent systematic review of the literature, in high-risk pregnant women, there is clear evidence of benefit concerning the role of fetal and umbilical Doppler in reducing the risk of perinatal death. [2]

Doppler indices of the uterine, middle cerebral artery, and ductus venosus have prognostic significance, but randomized studies do not as yet demonstrate benefit. [1]
Doppler Effect
Above. Doppler effect principle
The Doppler Effect principle is used in ultrasound as well as in other applications, such as meteorology and the military. The usual example is the change in the frequency of sound from an approaching train or car as the object is moving toward the individual compared to the frequency of sound as the object is moving away from the observer. The Doppler Effect is defined as the apparent change in wave frequency that occurs when a wave source and receiver are in relative motion, and the Doppler Effect is observed whether the source or the observer moves. [3] In ultrasound, the wave source is defined as red blood cells (RBC), and the receiver is the ultrasound transducer. The Doppler shifted frequency can be expressed as follows [2]:
Doppler shift (Fd) = Transmitted Frequency (Ft) – Received Frequency (Fr)
The red blood cells act both as moving receivers and as sources to the ultrasound beam.
Video Doppler.O.mp4
The Doppler shift equation then is [2]: fd=2ft v/c
where fd (Doppler shift) = 2* times ft (transducer frequency) times v (velocity of blood in a given direction) /c (speed of sound in the medium).
*2 is used since blood acts as both a receiver and as a transmitter.
The Doppler shift is proportional to velocity flow. The Doppler equation permits estimation of flow velocity, which is defined as the speed and direction of red blood cells in the circulation as follows:
V= fd times c/2 (ft X cos ?)
where (V) = velocity, (fd) = Doppler shift, (c) = speed of sound propagation in tissue, ft = transmitted beam and (cos?)=the angle of incidence between the ultrasound beam, and cos ? = the blood flow direction.

In summary, in order to determine velocity, the angle of the ultrasound beam and the RBCs incidence must be known in addition to the Doppler shift. The transducer frequency and the speed of sound in tissue are constants. [2]
Flow Velocity Waveform

Above. The flow velocity waveform is the graphic representation of velocity flow obtained by the Doppler frequency shift information. This graphic representation records the Doppler frequencies obtained in the volume sampled, and this spectral waveform displays the amplitude of the given frequencies over a cardiac cycle. Spectral Doppler is a graphic representation of flow and allows for the assessment of the waveform and the waveform’s quantitative measurement by Doppler indices, such as the S/D ratio. The magnitude of the Doppler frequency shift is reflected in the vertical axis, while the horizontal axis reflects time. Again, in any artery sampled, a single waveform represents one cardiac cycle, and the ultrasound display moves from right to left.

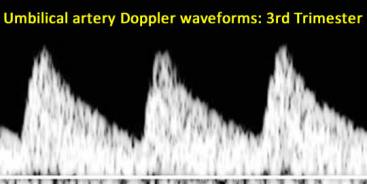
As pregnancy progresses there is relatively more flow in diastole, which lowers the ratio between the systolic component of the cardiac cycle and the diastolic component of the cardiac cycle. This increase in diastolic umbilical artery velocities as the pregnancy progresses reflects the decrease in resistance in the placental circulation with advancing gestation.
Types of Instrumentation
Above. Pulsed-Doppler, a single crystal acts as both an emitting and receiving transducer.
Pulsed-wave Doppler allows the determination of the target area of interest and is used in combination with real-time, two-dimensional (2-D) dynamic imaging to obtain a Doppler flow velocity waveform. This method obtains hemodynamic information from the circulation of interest and is most commonly used for fetal investigations. In pulsed-Doppler, a single crystal acts as both emitting and receiving transducer. Therefore, in pulsed-wave technology, this single crystal functions to emit and receive sound waves.
Continuous-wave Doppler ultrasound relies upon a transducer that continuously transmits and receives ultrasound signals. This method is used for fetal heart rate detections and electronic fetal monitoring but is not commonly used to assess the fetal circulation.
Color Doppler Imaging

Another application of the Doppler principle in ultrasound is color Doppler imaging. The color coding of the Doppler shift information allows the visualization and representation of flow in real time. By convention, when flow is coming toward the transducer, the color is coded red, and when the flow is going away from the transducer, the color is blue. A variety of applications are possible using color Doppler imaging, which include: placement of the cursor for spectral Doppler analysis (above), defining normal vascular anatomy and outflow tracts in the fetal heart, defining anomalies and fetal vascular tumors, assessing umbilical cord flow, and evaluation of placental abnormalities.

Above. Color power Doppler is a distinct form of color Doppler. Color power Doppler technology uses the color map to show the amplitude of the Doppler signal, but flow direction and velocity information are not possible.
Umbilical Artery Doppler and Placental Relationships

Above. In arterial circulations, the flow velocity waveform reflects downstream resistance or impedance. For the most commonly assessed fetal vessel, the umbilical artery, evaluation of the waveform allows information about the placenta to be gleaned and is a measure of placental insufficiency. Numerous studies correlate abnormal Doppler patterns with occlusive lesions of the placental vasculature and small artery obliteration of tertiary villi. [4]
Doppler Waveform Analysis
For pulsatile arterial circulation, each spectral Doppler waveform representation of flow can be analyzed by a Doppler index that considers the relationship between the systolic portion of the cardiac cycle and the diastolic portion of the cardiac cycle, as reflected in red blood cell flow for each blood vessel. Each index considers the maximum, minimum, and time of the frequency Doppler shift of the systolic and diastolic components of a cardiac cycle; and they are expressed as formulas.

These relationships are expressed as a resistance or impedance index as follows [5]:
- Resistance Index (RI) = S – D/S*
- Pulsatility Index (PI) = S- D/A**
- Systolic/Diastolic Ratio = S/D
- Each of the commonly used resistance indices has advantages and disadvantages:
- The S/D ratio is simple, not angle dependent, but cannot quantify zero flow.
- The RI is able to quantify zero flow which is important when measured in the umbilical artery in cases of placental insufficiency.
- The PI or timed velocity is more prone to error since a maximum frequency envelop must be included. However, no waveform index has shown clinical advantage over the others for uteroplacental and umbilical vessels.
*S = peak systolic velocity shift; D = peak diastolic velocity shift; **timed mean of the maximal frequency shift over one cardiac cycle.
Basic Fetal Doppler Principles
1. Waveforms can be measured and compared by indices (S/D, RI, PI).
2. Each vessel has its own “signature” waveform.
3. Arterial interrogation reflects “downstream” impedance to flow.
4. The umbilical artery was the first vessel studied and yields the most information.
5. In the umbilical artery, increased resistance, as reflected in the indices, correlates with abnormal placental vasculature and, therefore, signifies placental sufficiency or insufficiency.
6. Umbilical artery resistance normally falls with gestational age (as resistance falls in the placental circulation).
Indications for Fetal Doppler

Suspected fetal growth restriction on the basis of placental insufficiency is the major indication for fetal Doppler. Patients with hypertensive complications of pregnancy or those with suspected preeclampsia are at risk for fetal growth restriction, as are diabetic patients with vascular disease. At particular risk for growth restriction are patients with diamniotic monochorionic twin gestations.
Assessment of Fetal Circulation: Umbilical Artery
For clinical purposes, the umbilical artery is the most universally understood and applied fetal arterial vessel since it was one of the earliest circulations studied and is a relatively easy vessel to interrogate.
The Umbilical Artery Waveform’s Relationship to Placental Anatomy
The Doppler waveform is a reflection of placental anatomy and is a true test of placental insufficiency. As noted, correlations between microscopic placental anatomy and the umbilical artery waveforms suggest the presence of histological changes in the placenta, such as occlusive lesions (medial hyperplasia, luminal obliteration) of the placental vasculature when there is little flow in the diastolic component of the waveform, i.e., a high resistance index.
When is the Artery Doppler Value Abnormal?
Abnormalities of the umbilical artery occur when:
1. The resistance index is the ? 95th percentile for gestational age as defined by nomograms. Often there continues to be forward flow in diastole.
2. After 18 to 20 weeks, there is zero flow in diastole or absent-end diastolic flow (AEDF).
3. There is reversal of flow in the diastolic component or reversed-end diastolic flow (REDF).
These abnormal waveforms suggest progressive defects in placental vasculature and reflect progressive “placental insufficiency.”
The following demonstrate the abnormalities in the umbilical artery Doppler values and waveforms.


Above. Abnormal Doppler waveform is present in light of gestational age. Although there is flow in diastole, the S/D ratio of 5.2 at 33 weeks gestation is abnormal.

Above. This is a schematic representation of zero diastolic flow in the umbilical artery or absent-end-diastolic flow (AEDF).

Above. This represents an abnormal umbilical artery waveform with zero diastolic flow or absent-end-diastolic flow (AEDF). Note the inversion of the waveform does not change the validity of the flow velocity relationships.

Above. This is a schematic representation of reversal of diastolic flow in the umbilical artery or reversed-end-diastolic flow (REDF).

Above. This represents an abnormal umbilical artery waveform with reversed-end-diastolic flow (REDF).
Clinical Significance of the Umbilical Artery Waveform
In summary, what do abnormal Doppler values in the umbilical artery tell us?
Abnormal umbilical artery Doppler findings:
- Reflect placental vascular abnormalities [6];
- Are associated with growth restriction [5];,
- Are associated with karyotype abnormalities when the placenta is abnormal [7];
- Precede fetal death and predict length of stay in NICU [8];
- Are present in some malformations when the placenta is abnormal [9],
- Result in a decrease in perinatal mortality and trend toward reduction in perinatal deaths when used in the management of fetal growth restriction (FGR) (meta-analysis)[10];
- Show that reversed-end-diastolic flow is an independent contributor to poor neurodevelopment [11];
- Have a well-established relationship with birth weight. [12]

Above. Karsdorp’s classic description of the relationship between umbilical artery Doppler findings and birth weight in grams. The degree of abnormality of the umbilical artery waveform correlates with neonatal birth weight. [11]
Causes of Fetal Growth Restriction

A number of difficulties are inherent in assessing fetal Doppler results and their relationship to growth restriction. First, the heterogeneous cause of FGR in singletons can be broadly categorized as follows: (1) malformations, intrauterine infections, or chromosomal abnormalities; (2) maternal vascular and nutritional deficits; and (3) constitutionally small fetuses. Therefore, in the presence of growth restriction, careful ultrasound assessment is important to detect fetal infection, malformations, and ultrasound markers for fetal aneuploidy. In the presence of maternal hypertension, diabetes, preeclampsia, fetal growth restriction may be on the basis of altered placental vasculature, and fetal Doppler is an appropriate surveillance modality.
Management of Fetal Growth Restriction Due to Placental Insufficiency with Umbilical Artery Doppler
The standard definition for fetal growth restriction is an estimated fetal weight (EFW) percentile at the ? 10th percentile for gestational age. Integrated fetal testing for fetal growth restriction using both Doppler and biophysical parameters is recommended for the evaluation and assessment of fetal growth restriction. [13] While decreased end-diastolic velocities indicate abnormal placental villi, there is a wide range of potential outcomes between those placental abnormalities and the acid base status of the fetus. The following has been observed [12]:
Placental Abnormalities and the Fetal Acid Base Status
1. Doppler findings correlate with acid base findings and pO2 around a wide range. Fetal pO2 values in the range for late decelerations of the fetal heart are in the range of 13 to 15 mm. Hg.
2. Abnormal Doppler results including those of the ductus venosus and inferior vena cava also show a wide variation in pH.
3. Non-reactive fetal heart rate tracings demonstrate a wide range of potential outcomes.
4. Loss of fetal breathing is associated with a decrease in pO2, and absent fetal tone and gross body movements are associated with fetal acidemia.
5. No randomized clinical trials have specified the most effective testing modality or the necessary interventions to improve outcome in fetal growth restriction.

Above is a general scheme of testing based upon integrated testing principles. This method may not be appropriate in all patients and should not be used solely for management purposes. This management scheme uses umbilical artery Doppler information only. A variety of considerations are necessary, including gestational age, interpretation of test results, and administration of antenatal steroids for fetal lung maturity.

Above. If the EFW is ? the 10th percentile for gestational age, an umbilical artery (UA) Doppler determination and targeted scan should be performed. If the UA Doppler value is normal, a follow-up ultrasound EFW and Doppler measurement is usually scheduled at 3 week intervals, and weekly non-stress tests, biophysical profile, and Doppler testing are undertaken. In the presence of an abnormal umbilical artery value with diastolic flow present, daily fetal kick counts and twice-weekly testing with NST/biophysical profile and UA Doppler should be performed and expectant management undertaken. Delivery is indicated when the tests of fetal surveillance are confirmed to indicate fetal deterioration, such as a BPP of ? 4 or 6 depending upon the clinical circumstances. If fetal surveillance is reassuring, some clinicians consider delivery at 37 weeks. If absent end-diastolic flow (AEDF) is present, expectant management with daily testing could be considered at gestational ages of < 34 weeks, while delivery should be considered in patients with more advanced gestational ages. Most patients with reversal of diastolic flow (REDF) should be candidates for delivery irrespective of gestational age, but this may vary under special circumstances.
Fetal Doppler and Late Onset PIH
The following is a brief summary of an article entitled “Prediction of early- and late-onset pregnancy-induced hypertension using placental volume on three-dimensional ultrasound and uterine artery Doppler.” [14] Increased uterine artery resistance and small placental volume as measured by 3-D ultrasound placental volume at 11 to 13 weeks is associated with the development of early PIH, but is not associated with the development of late onset PIH. In early onset PIH, both neonatal weight and placental weight were lower, while there was no difference in the late onset PIH group and unaffected pregnancies, suggesting that early and late PIH may be different entities.
Fetal Doppler Overview: Small-for-Gestational Age Prediction
The following is a review of two articles studying prediction of small-for-gestational age (SGA) neonates at 30-34 weeks [15] and at 35-37 weeks. [16] Combined maternal characteristics and fetal biometry were used to predict SGA at 30-34 weeks. In the absence of preeclampsia (PE), maternal characteristics associated with SGA included increased inter-pregnancy interval, decreased height and weight, certain racial origins, cigarette smokers, prior history of SGA, and chronic hypertension. In the absence of PE, the Z-scores* of head circumference (HC), abdominal circumference (AC), femur length (FL) or estimated fetal weight (EFW) were reduced at 30 to 34 weeks gestation. Using these criteria, 80% of SGA neonates at < 10th percentile delivering at preterm with SGA were identified with a false positive rate of 10%.
*z Score: A z-score (aka, a standard score) indicates how many standard deviations an element is from the mean. A z-score can be calculated from the following formula: z = (X – ?) / ? where z is the z-score, X is the value of the element, ? is the population mean, and ? is the standard deviation.
The same methodology is used in the study to predict SGA neonates at 35-37 weeks. Similar maternal characteristics were noted at 35-37 weeks and combined with fetal biometry (EFW Z-scores), 90% of pregnancies were identified that delivered a SGA neonate within 2 weeks of assessment with a false positive rate of 10%. In addition, 70% of SGA neonates were predicted that delivered at ? 37 weeks.
Uterine Artery

The uterine artery and arcuate arteries comprise the major blood supply to the uterus, and fetal Doppler waveforms have been observed and measured in each circulation.
Abnormal uterine artery Doppler has been associated with adverse events, including:
- Preeclampsia
- Fetal growth restriction
- Perinatal death
Video abnutart.mp4
The uterine artery is a low resistance circulation, and after the 26th week, the diastolic notch should be absent. Unilateral or bilateral diastolic notching that persists beyond 24 to 26 weeks gestation is considered abnormal as well as resistance index values above the 95th percentile for gestational age.
Uterine Artery Clinical Application
A number of studies show a relationship between abnormal uterine artery Doppler and complications associated with placental insufficiency. The best time to screen for preeclampsia is 22 to 26 weeks, using a combination of 2-D ultrasound and pulsed color Doppler. [17] Screening does not predict all forms of hypertensive disorders, and overall screening programs demonstrate relatively low positive predictive values. [13]
In a randomized trial, no improvement of neonatal outcome was noted among patients undergoing uterine artery surveillance. [18]
Middle Cerebral Artery (MCA)

The middle cerebral artery (MCA) reflects fetal adaptation to hypoxia, while the peak systolic velocity correlates with fetal anemia.

The MCA is a relatively high-resistance circulation compared to the umbilical artery, and the above represents a normal waveform of the MCA.

Abnormal waveforms of the MCA are characterized by increased diastolic velocities, suggesting a decrease in resistance in the cerebral circulation, which occurs under conditions of fetal hypoxic stress and is termed “blood flow redistribution” or “brain sparing” effect. The Doppler angle on insonation should be less than 10°.

The relationship between the middle cerebral artery (MCA) and the umbilical artery (UA) may be important since it is a physiologic indicator of evolving fetal hypoxic stress. Under conditions of hypoxia, the diastolic velocities increase in the MCA while the end-diastolic velocities correspondingly decrease in the UA. However, the vasodilation of the MCA under these conditions is limited, and the MCA Doppler values, as well as the cerebral to umbilical ratio, are of limited value in the longitudinal assessment of the growth-restricted fetus. [19] Despite this observation, the abnormal cerebral placental ratio (CPR = RI-MCA/RI-UA) reflects the brain sparing effect and is associated with a decrease in the fetal pO2 and a 2-standard deviation median decrease in fetal pH. [12]
Recently, the cerebroplacental ratio (CPR) has been suggested as a marker of failure to reach growth potential at term. In addition, the CPR is an independent predictor of intrapartum fetal distress, admission to the neonatal unit at term, stillbirth, perinatal death and neonatal
morbidity. [20]
Ductus Venosus
Abnormal venous Doppler patterns have two possible mechanisms: increasing right ventricular afterload and myocardial failure. [15]

Above. Schematic anatomy of the ductus venosus (DV). LPV = left portal vein; IVC = inferior vena cava.

Above. Parasagittal color Doppler ductus venosus (DV) and inferior vena cava (IVC).
Venous patterns may be the best measure of deteriorating cardiac function, as cardiac size and filling pressure increases with hypoxemia. Failure of right heart filling or reduced ventricular output may affect the venous Doppler measurement. The most clinically relevant vein is the ductus venosus. Abnormalities of the ductus venosus waveform are associated with right heart dysfunction and, as such, reflect the final evidence for fetal decompensation due to chronic hypoxemia secondary to placental insufficiency.
3 Phases of Normal Flow Velocity Waveform
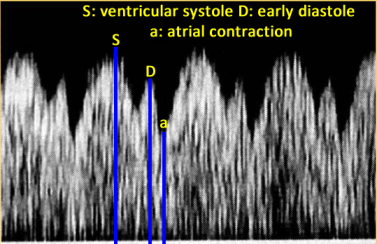
The normal flow velocity waveform of the ductus venosus is described in 3 phases and reflects events in the fetal right ventricle and right atrium as follows:
• (S) right ventricular systole
• (D) early ventricular diastole
• (a) right atrial contraction

Above. Abnormal A-Wave
An absent or reversed A-wave in the ductus venosus is considered abnormal. The duration of persistent absent or reversed flow of the A-wave of the ductus venosus is a strong predictor of stillbirth. This finding is independent of gestational age, while prolongation of pregnancy for greater than 1 week is unlikely under this setting. [21]
Sequential Changes in the Fetus Due to Placental Insufficiency
As the growth-restricted fetus progresses from normal oxygen status to hypoxemia and ultimate death, there is a sequence of Doppler arterial and venous abnormalities that is likely to occur. Uterine artery Doppler measurements signal the failure of trophoblastic invasion by displaying persistence of the diastolic notch as well as decreasing diastolic velocities in the waveform.

Sequential changes in growth restriction due to placental insufficiency have been described for mild, progressive, and severe early-onset disease, and Doppler manifestations are related to the gestational age at onset and to the severity of placental vascular abnormality. [22]

Following the diagnosis of growth restriction, the pattern of progression can be determined by weekly assessment of the umbilical artery Doppler values. Following 14 days, rapid progression of the disease can be discerned by deterioration of umbilical Doppler values and those of other vessels. [17]
Fetal Doppler: Imaging Considerations
Page Links: The Principles, Definitions: Aliasing, Image Acquisition: Umbilical Artery, Obtaining Waveforms for Umbilical Artery: Summary, Some Factors Affecting Umbilical Artery Indices, Fetal Activity and Breathing: Affects Doppler Indices, Maternal Activity and Breathing: Affects Doppler Indices, Fetal Irregular Rhythm: Affects Doppler Indices, Obtaining Waveforms of the Middle Cerebral Artery (MCA), Obtaining Waveforms of the Ductus Venosus, References
The Principles of Fetal Doppler Imaging
The Doppler shift is proportional to velocity flow, and the Doppler equation permits estimation of flow velocity, which is defined as the speed and direction of red blood cells in the circulation as follows:
V= fd times c/2 (ft times cos ?) where V = velocity, fd = Doppler shift, (c) = speed of sound propagation in tissue, ft = transmitted beam, and cos ? = the angle of incidence between the ultrasound beam and the blood flow direction.
In order to determine velocity, the angle of the ultrasound beam and the incident RBCs must be known in addition to the Doppler shift. The transducer frequency and the speed of sound in tissues are constants. [23]

In using pulsed-wave Doppler, the ultrasound crystal acts as both a transmitting beam and a receiving beam. [24]
Definitions: Aliasing
Pulses are transmitted at a given sampling frequency. The maximum Doppler frequency that can be measured unambiguously is half the transmitted frequency (the pulse repetition frequency, PRF). If the blood velocity and beam/flow angle being measured combine to give the maximum Doppler frequency a value greater than half of the pulse repetition frequency, ambiguity or aliasing in the Doppler signal occurs. [2]

Above. This is an example of aliasing. The pulse repetition frequency (PRF) or the scale is set too low.

Above. This is an improvement over the previous image, with the pulse repetition frequency (PRF) or the scale being set at a higher level.
Image Acquisition: Umbilical Artery
Below is a summary of optimum methods for Doppler interrogation of fetal vessels:
1. Use color Doppler to determine the vessel of interest.
2. Adjust gain or PRF to prevent aliasing.
3. For low velocities, low PRF or color scale should be used (aliasing will occur if high velocities are encountered).
4. Define the area of interest and reduce the width and maximum depth of the color flow area under investigation.
5. Place the focal point at the area of interest.
6. Place a Doppler cursor within the vessel of interest.
7. Adjust the gate size. Unless volume measures are being determined for the umbilical artery, the gate may overlap the umbilical artery and vein.
8. The beam/vessel angle should be 60° or less if velocity measurements are to be taken.
Other Fetal Imaging Considerations:
1. Obtain mid-segment.
2. Perform study during quiet fetal state.
3. Use appropriate SVS (sample volume size [the same as “gate”]): usually 3 mm mid-trimester.
4. Assess a minimum of 3 to 5 waveforms.
Obtaining Waveforms for Umbilical Artery: Summary

1. Obtain mid-segment fetal image. When clear vessels are demonstrated in 2-D gray scale, place the Doppler cursor first.

2. When Doppler gate and appropriate angle corrections are made, rapid display of umbilical artery Doppler data can be achieved.

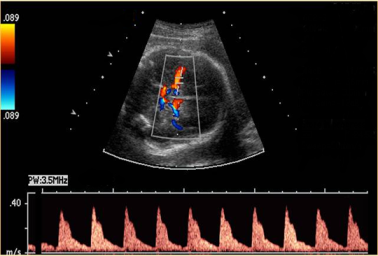
3. Color flow Doppler demonstration of umbilical artery and normal Doppler waveform illustrates scale, region of interest, focal point, and Doppler result.

Above. Schematic of progressively abnormal umbilical artery waveforms. See Doppler Information section for more examples of abnormal umbilical artery waveforms.
Some Factors Affecting Umbilical Artery Indices
Sample site: Affects Doppler indices

For the umbilical artery, the highest resistance is near the fetal abdominal cord insertion site.

For the umbilical artery, the lowest resistance is near the placental cord insertion site. Select a mid-cord segment. There is no need to angle correctly, since it is the ratio between systolic and diastolic velocities that is of interest and not the absolute velocity value.
Fetal Activity and Breathing: Affects Doppler Indices

Above. Note variations in diastolic velocities in the presence of fetal breathing and activity.
Maternal Activity and Breathing: Affects Doppler Indices

Above. Note variations in diastolic velocities and overlap of waveforms in the presence of maternal breathing and activity. Also note the presence of aliasing, which can be adjusted by increasing the pulse repetition frequency (PRF) or scale.
Fetal Irregular Rhythm: Affects Doppler Indices

Above. Note variations in diastolic velocities in the presence of an irregular fetal cardiac rhythm.
Obtaining Waveforms of the Middle Cerebral Artery (MCA)

1. Obtain a transverse view of the fetal brain at the biparietal diameter level. Zoom image to see the entire length of the MCA.


2. Use color flow to identify the Circle of Willis and the MCA, which is the major lateral branch of the Circle of Willis which courses anteriolaterally.

3. Place the pulsed-Doppler sample just proximal to the Circle of Willis and, if possible, acquire the anterior vessel in the circle.

4. Angle correctly to obtain an angle of insonation, which is in the range of 2-4°, but always less than 10°.
5. Avoid transducer-induced pressure to the fetal head since transducer pressure will alter the recordings.
Above. Normal waveforms of fetal middle cerebral artery with relatively high resistance (low diastolic velocities).

Above. Abnormal waveforms of middle cerebral artery with relatively low resistance (high diastolic velocities).
Obtaining Waveforms of the Ductus Venosus
- Scan in the upper abdomen in a mid-sagittal longitudinal plane.
- Scan to the left first, identifying the fetal stomach bubble.
- In the same plane, activate color Doppler over the fetal liver.
- Identify the umbilical vein and the ductus venosus (See below).
- Velocities in the DV may be higher than the umbilical vein, and gain may need to be adjusted.
- Aliasing is a clue that the DV is being imaged.
- Sample volume size may be in the 2 mm. range.
- A typical S,D,A waveform is normal, and there is no reversal of flow in diastole (See below).
- An absent or reversed A-wave is considered abnormal (See below).

Above. The umbilical vein enters the fetal abdomen in an ascending direction. It then travels more horizontally and to the right near the region of the right portal vein. The ductus venosus (DV) arises from the umbilical vein in this region and descends steeply toward the head to enter the inferior vena cava.

Above. To identify the DV, a sagittal scan for the fetal upper abdomen should be taken initially toward the left side to include an image of the fetal stomach. The transducer is then moved longitudinally toward the right side of the fetus. Using color Doppler, the umbilical vein and DV can be identified through a mid-sagittal longitudinal section of the fetal liver. The origin of the umbilical vein can be determined by an oblique transverse section through the upper abdomen, and color Doppler may indicate higher velocities of the DV compared to the umbilical vein. [2] The aliasing is a clue that the sample is in the DV (See above). The lumen of the DV is smaller than the umbilical vein, and a smaller sample volume size (2 mm or less) may be needed to obtain adequate Doppler velocity waveforms.

Above. As noted previously, the normal flow velocity waveform of the ductus venosus is described in 3 phases and reflects events in the fetal right ventricle and right atrium as follows:
• (S) right ventricular systole
• (D) early ventricular diastole
• (A) right atrial contraction

Above. In addition, an absent or reversed A-wave in the ductus venosus is considered abnormal. The duration of persistent absent or reversed flow of the A-wave of the ductus venosus is a strong predictor of stillbirth, and this finding is independent of gestational age, while prolongation of pregnancy for greater than 1 week is unlikely under this setting. [25]
-
Abstract: PMID: 22464066 -
Abstract: PMID: 30480756 Maulik, Dev. Physical Principles of Doppler Ultrasonography. In Doppler Ultrasound in Obstetrics and Gynecology. Maulik, D, ed. Springer-Verlag, Heidelberg, 2005. pp 1-17. -
Abstract: PMID: 9351773 Maulik, Dev. Spectral Doppler Sonography: Waveform Analysis and Hemodynamic Interpretation. In Doppler Ultrasound in Obstetrics and Gynecology. Maulik, D, ed. Springer-Verlag, Heidelberg, 2005. pp 43-54. Ott, William J. Doppler Utrasound in the Diagnosis and Management of Intrauterine Growth restriction. In Doppler Ultrasound in Obstetrics and Gynecology. Maulik, D, ed. Springer-Verlag, Heidelberg, 2005. pp 281-298. -
Abstract: PMID: 8671238 -
Abstract: PMID: 8203434 -
Abstract: PMID: 2405318 -
Abstract: PMID: 7755042 -
Abstract: PMID: 19072744 -
Abstract: PMID: 7996959 -
Abstract: PMID: 12528152 -
Abstract: PMID: 25042564 -
Abstract: PMID: 25585604 -
Abstract: PMID: 25728139 Guzman ER, Kontopoulos E, Zalud, E. Doppler velocimetry of the Uteroplacental Circulation. Maulik, D, ed. In Doppler Ultrasound in Obstetrics and Gynecology. Springer-Verlag, Heidelberg, 2005. pp 250. -
Abstract: PMID: 1360032 Nicolaides K, Rizzo G, Hecker K, Ximenes R. Diploma in Fetal Medicine and ISUOG Educational Series, Doppler in Obstetrics, The Fetal Medicine Foundation, 2002. -
Abstract: PMID: 27720309 -
Abstract: PMID: 21465604 -
Abstract: PMID: 18634130 Physical Principles of Doppler Ultrasonography. Maulik, D. Doppler Ultrasound in Obstetrics and Gynecology. Springer-Verlag, Heidelberg, 2005. pp 1-17. Diploma in Fetal Medicine and ISUOG Educational Series, Doppler in Obstetrics. Nicolaides K, Rizzo G, Hecker K, Ximenes R. The Fetal Medicine Foundation 2002. Link -
Abstract: PMID: 21465604
3
5
6
17
19
23
24